Cooking up Findability by Category
Cooking up Findability by Category
When Empathy Data Team became Chefs of Analytics
As happens many times in the Analytics world, this story starts with a question:
What product categories are the most relevant to my customers?
Not unlike creating an enticing restaurant menu, knowing what attracts our customers is essential to standing out in the market. As Data Analysts specialising in Search and Discovery, we can analyse how the different product categories evolve, revealing if a category is more in demand at a specific time of the year, and take action on what we learn.
All this led the Empathy Data team and I to experiment and dig deeper into how often customers find the products they are searching for within the different product categories. Here we begin to apply this idea of Findability — products you want appearing on the first page of results — to obtain information at the category level. And so our cooking adventure begins too…
Spoiler alert: A new metric for Empathy Playboard was born.

Put on your chef’s hat
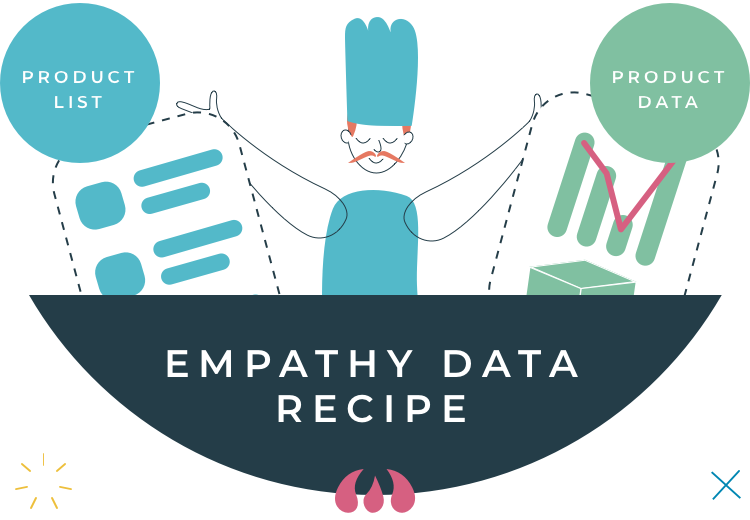
With our goal in mind, it was time to get cooking and gather the ingredients for the product categories. At this point in the story, the Data team and I become chefs of analytics, creating the best recipe to define our Findability by Category.
From the beginning, we were clear on our main ingredients:
- List of products in the category
- Data on customer interactions with these products (like adding items to your cart)
With these fresh ingredients in hand, we got to work and started experimenting to find our perfect formula.
We used the product IDs of a category to get two important elements: terms that shoppers used to find those products, and data on shopper interactions with them. Of course, keeping in mind this is zero-party anonymous data, respecting shopper privacy. With this, we will have the data to analyse and understand the product category.

Once we have all the data ‘cooked’ and ready to use, it’s time to put the final touch on our plate and obtain the KPIs that we consider relevant:
- Add to Cart (%)
- Findability (%)
- Volume of queries
- Revenue
Surpassing the taste test
As in all good stories, we save the best for last — to try our dish and savour the flavour. For data lovers, that’s analysing the category data and getting the insights we want. In the end, we created recipes for even more than Findability…
- Metrics by category: Compare how engagement and performance vary among the different product categories. Understand which are the most relevant categories for shoppers. For example, which category of products has the highest Add to Cart or Findability rate.
- Terms within a category: Analyse terms that shoppers use to find products of a given category. Understand their KPIs to see which terms are relevant for customers and which aren’t.
Now it’s time to take these recipes and put them into practice. Dare to cook your own Findability by Category!


